 Jules Belveze
One Linear layer broke my INT8 encoder
My last two posts made the case for fine-tuned encoders when the job is classification. The next question was fairly obvious: once you have a model that works, how much cheaper can you make it to serve?
I started with dynamic INT8 quantization. Same checkpoint, smaller weights, CPU inference. Instead, my fine-tuned UltraBERT went from 77 to 29 macro-F1 on the test set. It still returned labels. Most of them were now concentrated in two classes.
The eventual fix was small: leave one Linear projection in FP32 and quantize the rest. Finding it took more work. And after the score recovered, I found another problem that an aggregate metric was quite happy to hide.
The obvious checks didn’t help
The task is the same kind of newsletter-section classification I used before: predict a section from an article summary. Same disclosure applies: my dataset, my label mapping. These labels encode editorial conventions as well as topics. This experiment uses a fresh, text-deduplicated split, so its scores aren’t a continuation of the earlier leaderboard.1
I fine-tuned UltraBERT-150M, then converted its Linear modules using PyTorch’s eager dynamic INT8 path. Embeddings and normalization stayed FP32. The exact path matters here: this is the Torch 2.8 x86 implementation, not a result about every INT8 runtime.
First I checked the saved artifact. Reloading reproduced the bad predictions, so serialization wasn’t the explanation. Changing batch size and removing padding didn’t restore quality either.
Then I split the model into groups. Quantize attention alone, and quality stayed close to FP32. Quantize the feed-forward networks, and it collapsed. Keeping the classifier in FP32 didn’t help.
That gave me somewhere to look.
Rounded weights weren’t enough to explain it
UltraBERT’s feed-forward network has two branches. One passes through a SiLU activation; their outputs are multiplied, then a down projection maps that product back to the hidden width:
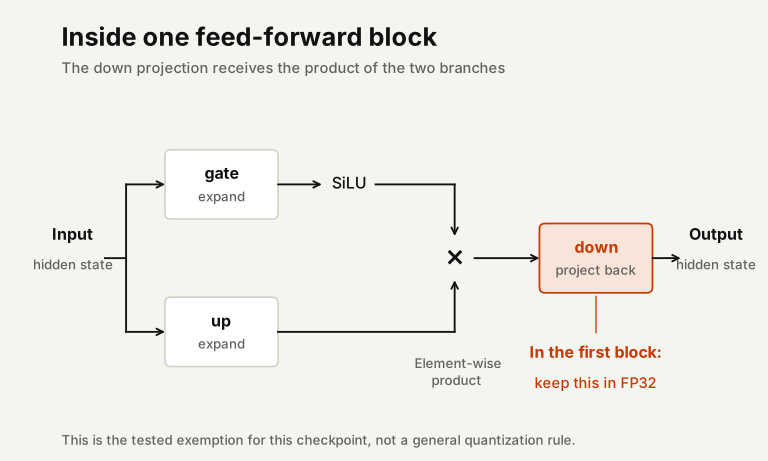
hidden = silu(gate_proj(x)) * up_proj(x)
output = down_proj(hidden)
Quantizing the gate and up projections left every predicted class unchanged on my small diagnostic subset. Quantizing the down projections reproduced the failure.
I tested whether weight rounding alone could explain it. I rounded the FFN weights to their INT8 values, dequantized them, and ran the operations in FP32. That kept the weight-rounding error while taking the dynamic INT8 execution path out of the experiment. Quality stayed close to the reference.
That distinction is easy to miss. In dynamic quantization, activations are quantized during execution too. A quantized Linear operation can accept and return floating-point tensors while doing different work internally from an FP32 operation with rounded weights.
The control narrowed the problem to that runtime path. It didn’t tell me whether activation quantization or backend arithmetic was responsible. I still don’t have that numerical explanation.
The largest error was a bad debugging shortcut
I also measured the error each quantized FFN operator introduced when given the same input it received in the FP32 model. The largest local error was in an up projection much later in the network. Yet quantizing all the up projections had changed no class predictions.
The end-to-end interventions pointed elsewhere. Quantizing the first FFN block alone caused a large drop; individually quantizing the other blocks barely changed the score.
So the operation with the largest isolated error wasn’t the operation whose quantization did the most damage. Downstream computation and decision margins matter. Ranking tensor errors alone would have sent me in the wrong direction.
The two useful clues were now the down projections and the first block. I tested their intersection:
ultrabert.layers.0.mlp.down_proj
Quantizing just that projection was enough to cause severe degradation. Keeping it in FP32 while quantizing the other 168 Linear modules recovered most of the lost quality:
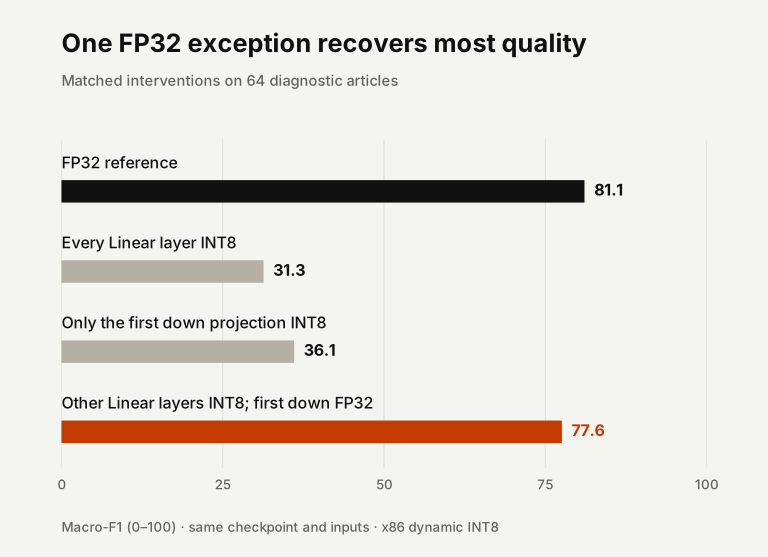
These interventions use the same 64 validation articles. I used them to find the exemption, so the recovery needed a broader check before it meant much.
The rescue wasn’t perfect. Some predictions still differed from FP32. But I now had an actual intervention and a corresponding recovery, rather than a list of suspicious-looking tensors.
The rescue still changes with batching
I froze the exemption and evaluated it on the remaining validation articles, which hadn’t been used for the quantization diagnosis. The original checkpoint selection had used full validation, so this wasn’t an untouched holdout.
The result looked usable: macro-F1 stayed within about a point of FP32 across the batching and padding policies I checked. I could have stopped at that score.
Then I compared the individual predictions.
At fixed padding, switching from a batch of 16 to processing each article alone changed 67 of 1,156 INT8 decisions. FP32 changed none. The aggregate score actually improved slightly: processing alone corrected 33 mistakes against the dataset labels, but introduced 28 others. The remaining changes were between two labels that both disagreed with the dataset.
Here is the first changed example in validation order, a summary about GitHub Copilot. In a batch it reads as Headlines & News; alone it becomes Guides & Resources. Same summary, same checkpoint, same padding length.
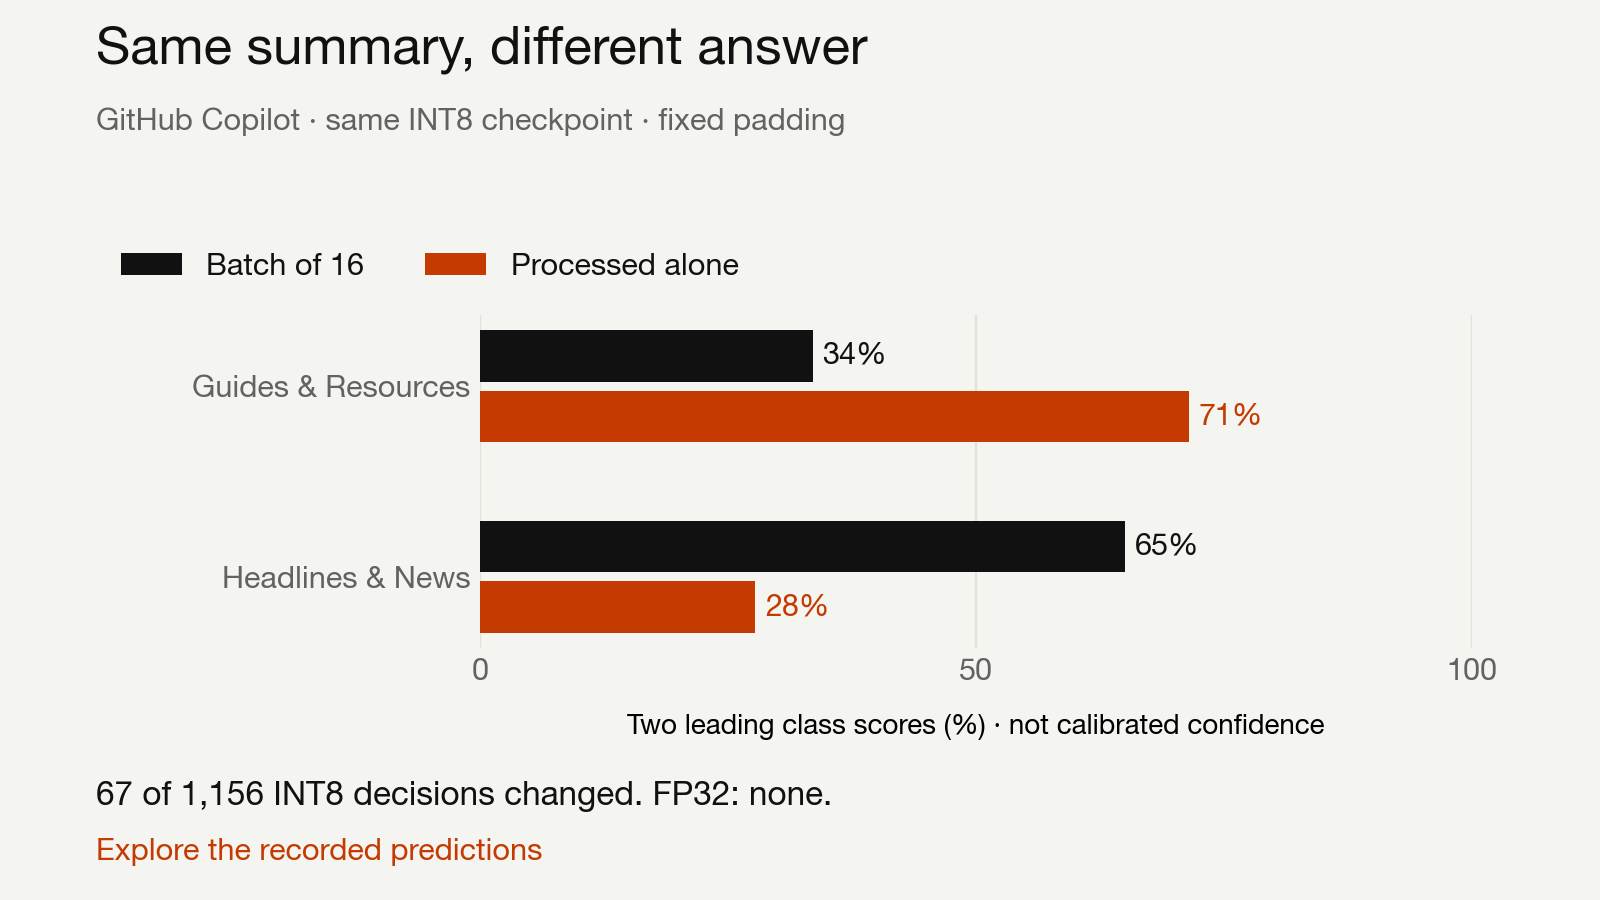
Try another article, switch the processing policy, or compare with FP32. The bars show normalized model scores, not calibrated confidence. Open the full explorer →
This doesn’t prove that a particular batch companion caused the change. The experiment changes the batching policy, including the shape of the operation. It does establish that, for this recipe, batching belongs in the inference configuration you validate. Passing a save/reload check doesn’t establish that the model will make the same decisions under a different serving policy.
For a classifier used to route requests, that seems more useful to know than another decimal place of macro-F1.
Smaller did not mean proportionally faster
The frozen exemption produced a deployment artifact about 55% smaller than FP32, with 23% lower median CPU latency at actual input length. The observed macro-F1 cost under that policy was less than a point. Useful savings, although the size reduction was much larger than the speed improvement.2
Padding was a bigger speed lever in this run. Removing fixed-length padding more than halved the FP32 median latency. Compare padded FP32 with unpadded INT8, and you can accidentally credit quantization for most of that improvement.
I would still benchmark a smaller FP32 model before adopting the exemption. The small Ettin baseline was much faster in the original comparison, at a quality cost. Whether that tradeoff is acceptable depends on the task; compression should earn the extra moving parts.
What I’d take into the next deployment
I set out to make an encoder cheaper. I ended up needing two different debugging loops: one to find where quantization damaged the model, and another to check whether the recovered model behaved consistently under serving changes.
The first loop needed interventions. Weight rounding, operator error and a bad end-to-end prediction are related observations, but they don’t answer the same question. The second needed per-example comparisons. A slightly better score can conceal regressions on individual inputs.
I added the conversion, exemption and reload checks to a standalone bert-squeeze example. You can use it with a public demo checkpoint or your own classifier. The measured UltraBERT checkpoint isn’t public yet, so it doesn’t currently offer a public reproduction of these exact scores. And the module I exempted is a finding for this checkpoint, not a default I’d copy to another encoder.
That’s the check I’d keep even if the exemption turns out not to transfer: validate the model you will actually serve, under the batching policy you will actually use, and look at which answers changed.
-
The methods and recorded results collect the split, label mapping, ablations and runtime pins. The newsletter taxonomy has ambiguous mappings, and source-article overlap remains after text deduplication. This is a numerical case study on one checkpoint, not evidence of generalization to future newsletters. The rescued recipe wasn’t evaluated on test data. ↩
-
The paired CPU measurements used the same worker, inputs and thread settings. They don’t establish production tail behavior or runtime memory use. A fresh-runtime check matched the final validation scores but differed on two diagnostic INT8 scores and timings; both observations are retained in the methods page. Their cause remains unresolved. ↩